
Spot hazards automatically
NewComputer vision on phone and dashcam video flags potholes, cracks and missing signs.
Impact area 01 · Safer roads & mobility lab
We study why streets hurt people, then design and test the fix before anything is built.
What we do
IRC-based audits with crash and hazard data, street by street.
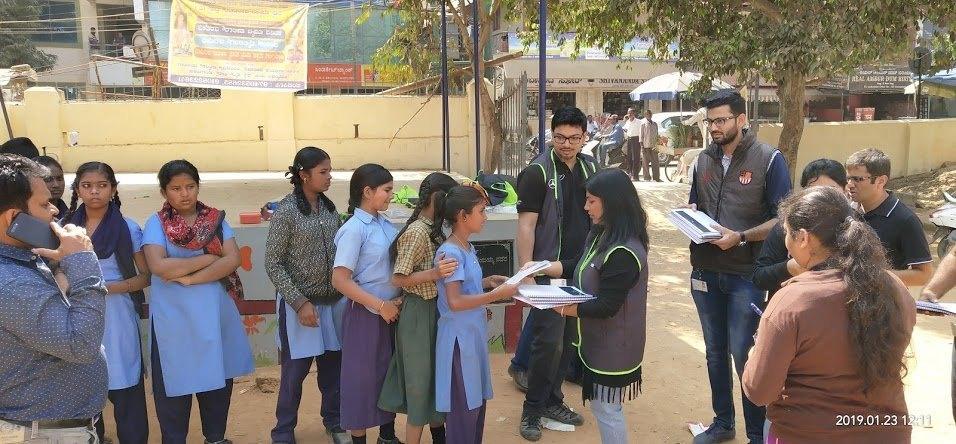
Research-led school routes, measured before and after.
Designs tested in traffic simulation before work starts.
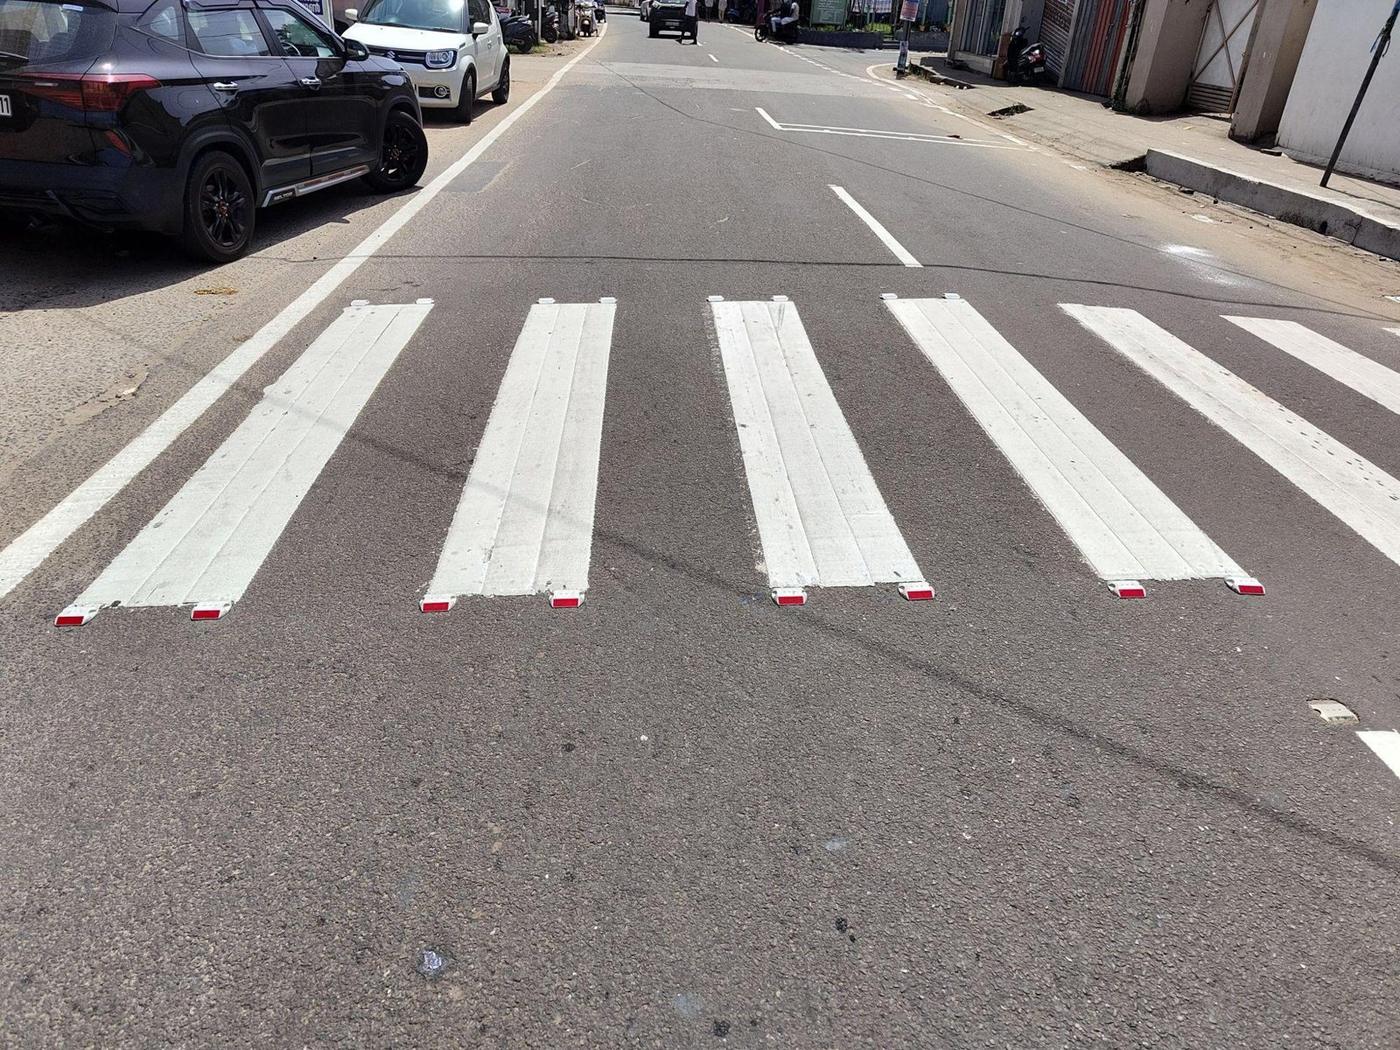
Crossings, speed tables, signs and lights, kept up by the community.
Live in usePilot trialledNew in development
Road restoration (potholes, signs and lights) starts at one 2 km stretch or 1,000 m² of repairs. No single potholes or stand-alone signboards.
lives lost on Indian roads in 2022, about 460 a day
MoRTH, Road Accidents in India 2022 · SDG target 3.6
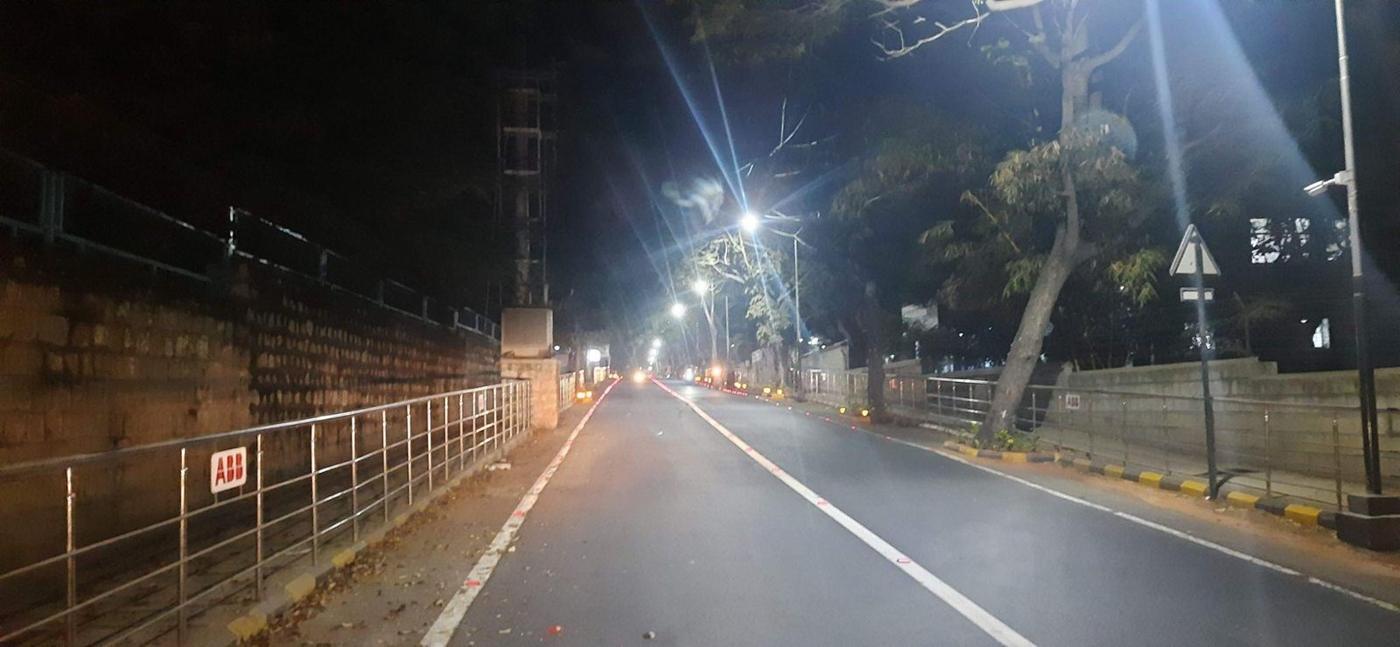
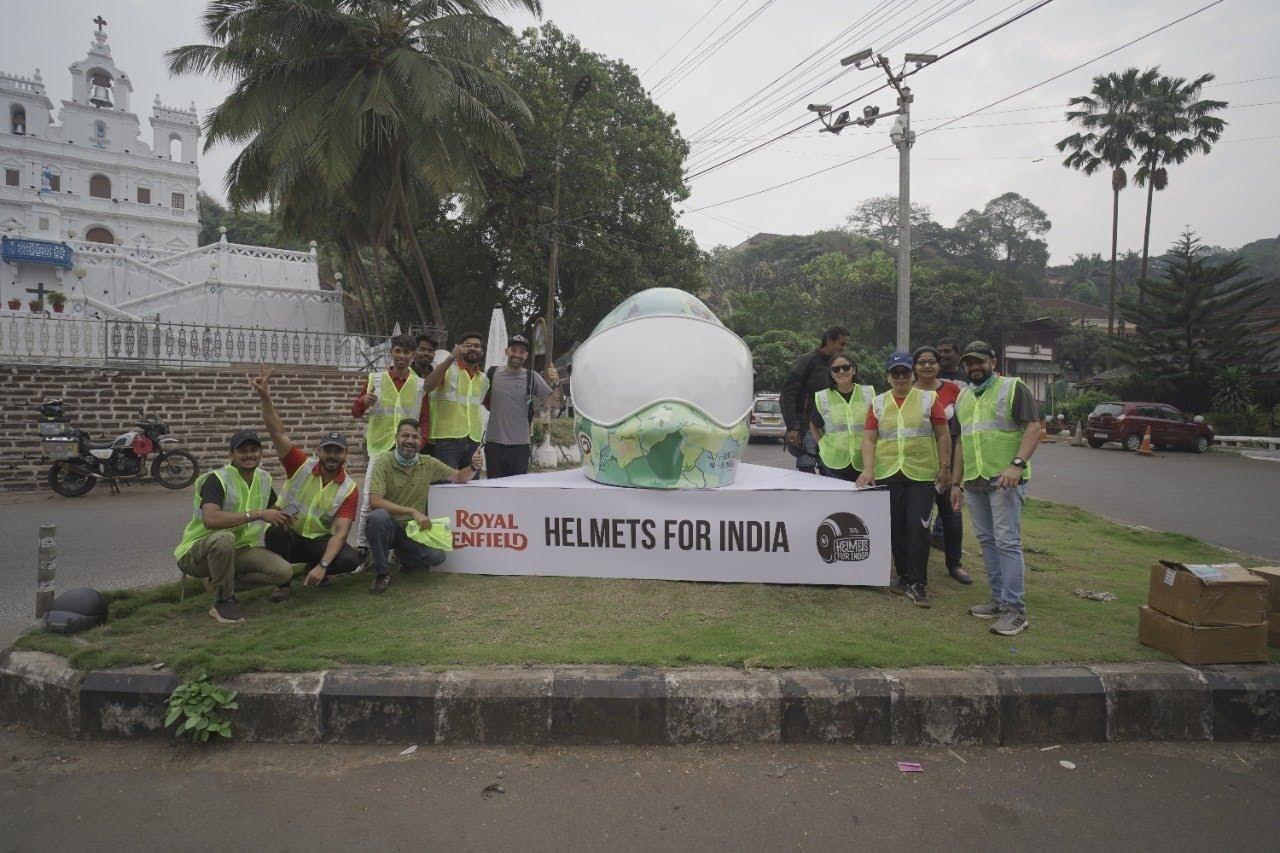
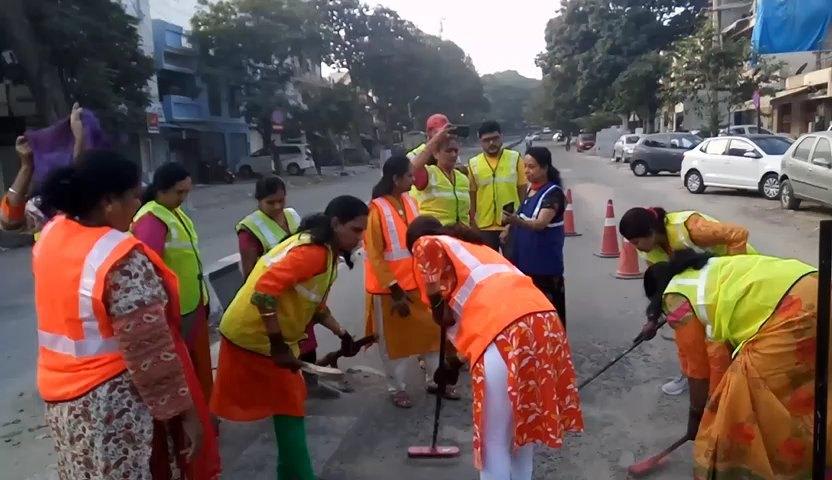
Built on: ABB’s ₹14 Cr model road, Goodyear’s model junction, Hyundai with PWD Kerala, and 20 school zones with Mercedes-Benz.
AI for road safety
The same field data that proves each repair today becomes the input for prediction and design. The new pieces are where we want technology and research partners to build with us.
Computer vision on phone and dashcam video flags potholes, cracks and missing signs.
Risk scores combine hazards, crash records, schools, speed and lighting.
A digital twin of a junction tests crossings, signals and speed tables.
Our internal app logs size, depth, before-and-after photos and sign-off for each repair.
Every ride becomes a road survey Pilot Vehicle sensors from automobile makers, IIT research and other sensor data build pothole and rough-road heat maps, so companies can adopt hot spots near their sites (at least 10 hot spots or one ward) and cities can fix the worst stretches first. How it works
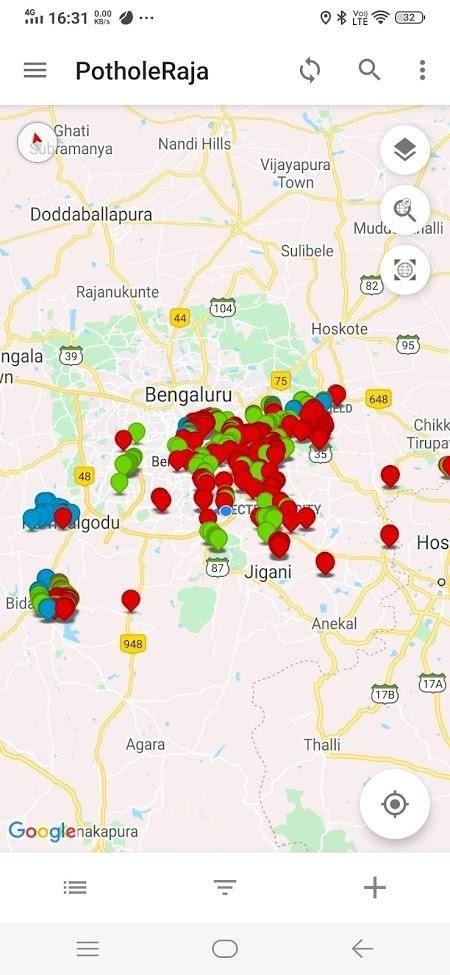
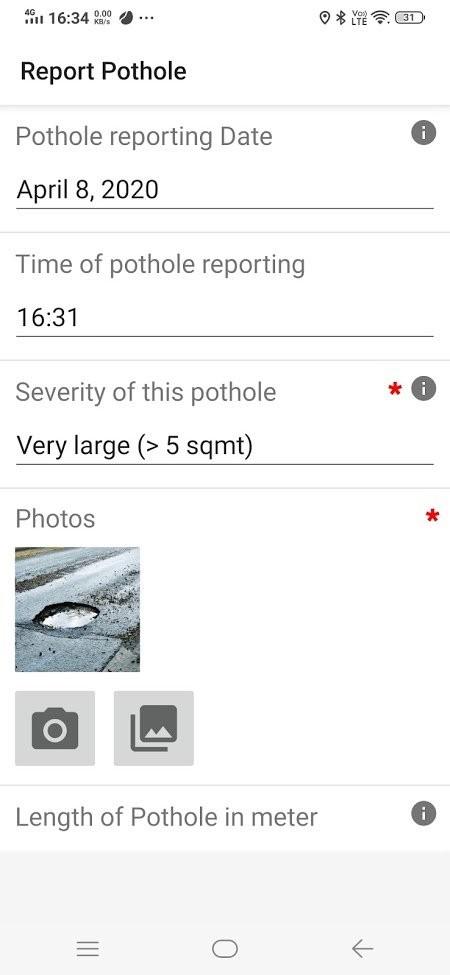
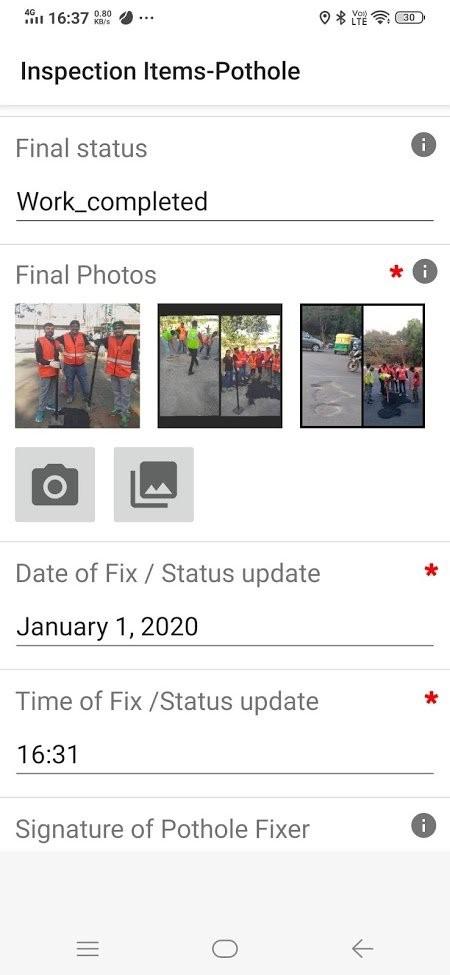
Internal tool: our field app records each repair before and after, so we can monitor the work and share the results with partners. Our teams use it; it is not a public app.
New = in development, open to technology partners. See the whole platform on the Capabilities page.
In the news
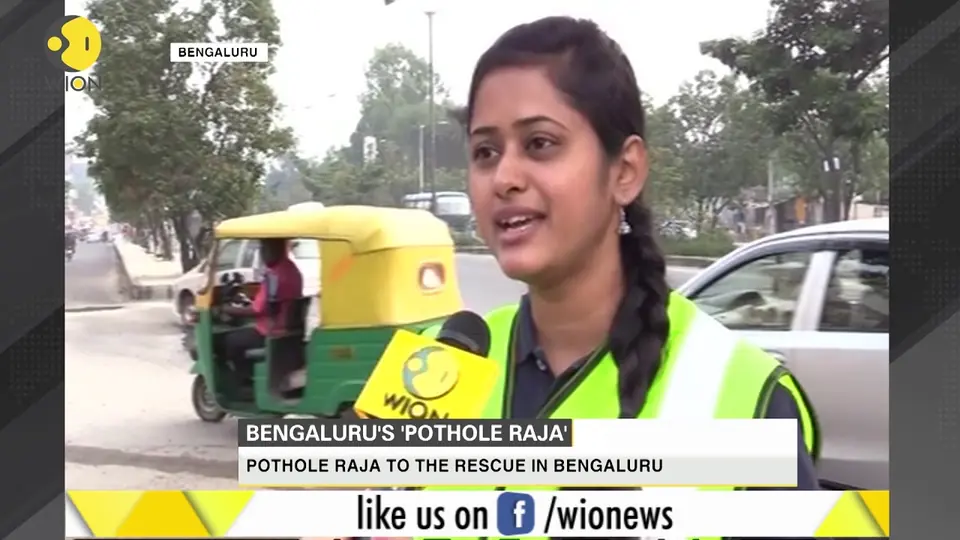 WIONBengaluru's 'Pothole Raja': a unique initiative by citizens
Programmes in this area
Map, score and fix a city’s riskiest roads with AI and crews.
Safe routes for school clusters, taught by your employees.
Students and faculty solve real road problems with our data.
Live in usePilot trialledNew in development
SDG fit: 3 (target 3.6, road deaths) and 11 (target 11.2, safe transport). Schedule VII fit: (ii), including road-safety awareness. Confirm eligibility per project with your CSR advisor.
Start with the facts
Give with an 80G tax benefit, bring your company's CSR, or join a drive near you.